Temperature Colours
The background colour shows the minimum, average and maximum temperatures for the period. The background behind the wind symbol shows the minimum temperature. The background behind the time symbol shows the average temperature. The background behind the rain symbol shows the maximum temperature. The colours are:
Less
than
-6°C
-6°C
to
-3°C
-3°C
to
0°C
0°C
to
3°C
3°C
to
6°C
6°C
to
9°C
9°C
to
12°C
12°C
to
15°C
15°C
to
18°C
18°C
to
21°C
21°C
to
24°C
24°C
to
27°C
27°C
or
over
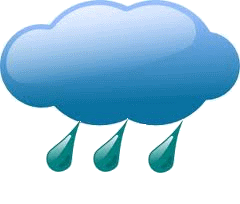
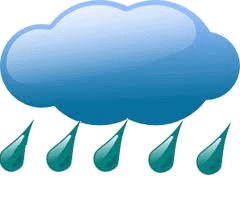
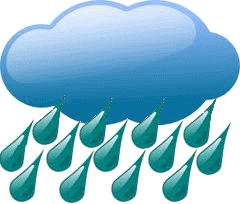
Rain Symbols
The rain symbol shows:
- the average quantity of rain per day for monthly summaries,
- the quantity of rain during the day for daily summaries.

Less
than
0.01 mm

0.01 mm
to
1 mm

1 mm
to
2 mm
2 mm
to
3 mm

3 mm
to
5 mm
5 mm
to
10 mm

10 mm
to
15 mm

15 mm
to
25 mm
25 mm
or over
Rain Time Symbols
For monthly overviews, the rain time symbol shows the number of hours it was raining between the hours of 8am and 8pm (rounded to the nearest 12 hours). Each hour of the clockface is equivalent to a solid day of rain between 8am and 8pm:
Dry

12 hours
(1 day)

24 hours
(2 days)

36 hours
(3 days)

48 hours
(4 days)

60 hours
(5 days)

72 hours
(6 days)

84 hours
(7 days)

96 hours
(8 days)

108 hours
(9 days)

120 hours
(10 days)

132 hours
(11 days)

144 hours
(12 days)
Dry
1 hours
2 hours
3 hours
4 hours
5 hours
6 hours
7 hours
8 hours
9 hours
10 hours
10 hours
12 hours
Wind Symbols
The wind symbol shows the maximum wind speed recorded during the period:
Less
than
2 knots

2 knots
to
7 knots

7 knots
to
12 knots

12 knots
to
17 knots

17 knots
to
22 knots

22 knots
to
27 knots

27 knots
to
32 knots

32 knots
to
37 knots

37 knots
to
42 knots

42 knots
to
47 knots

47 knots
to
52 knots

52 knots
to
57 knots

57 knots
to
62 knots

62 knots
to
67 knots

67 knots
or
over
The site is normally updated every 15 minutes. The station was commissioned on 9 October 2017.
Back to Top of Page